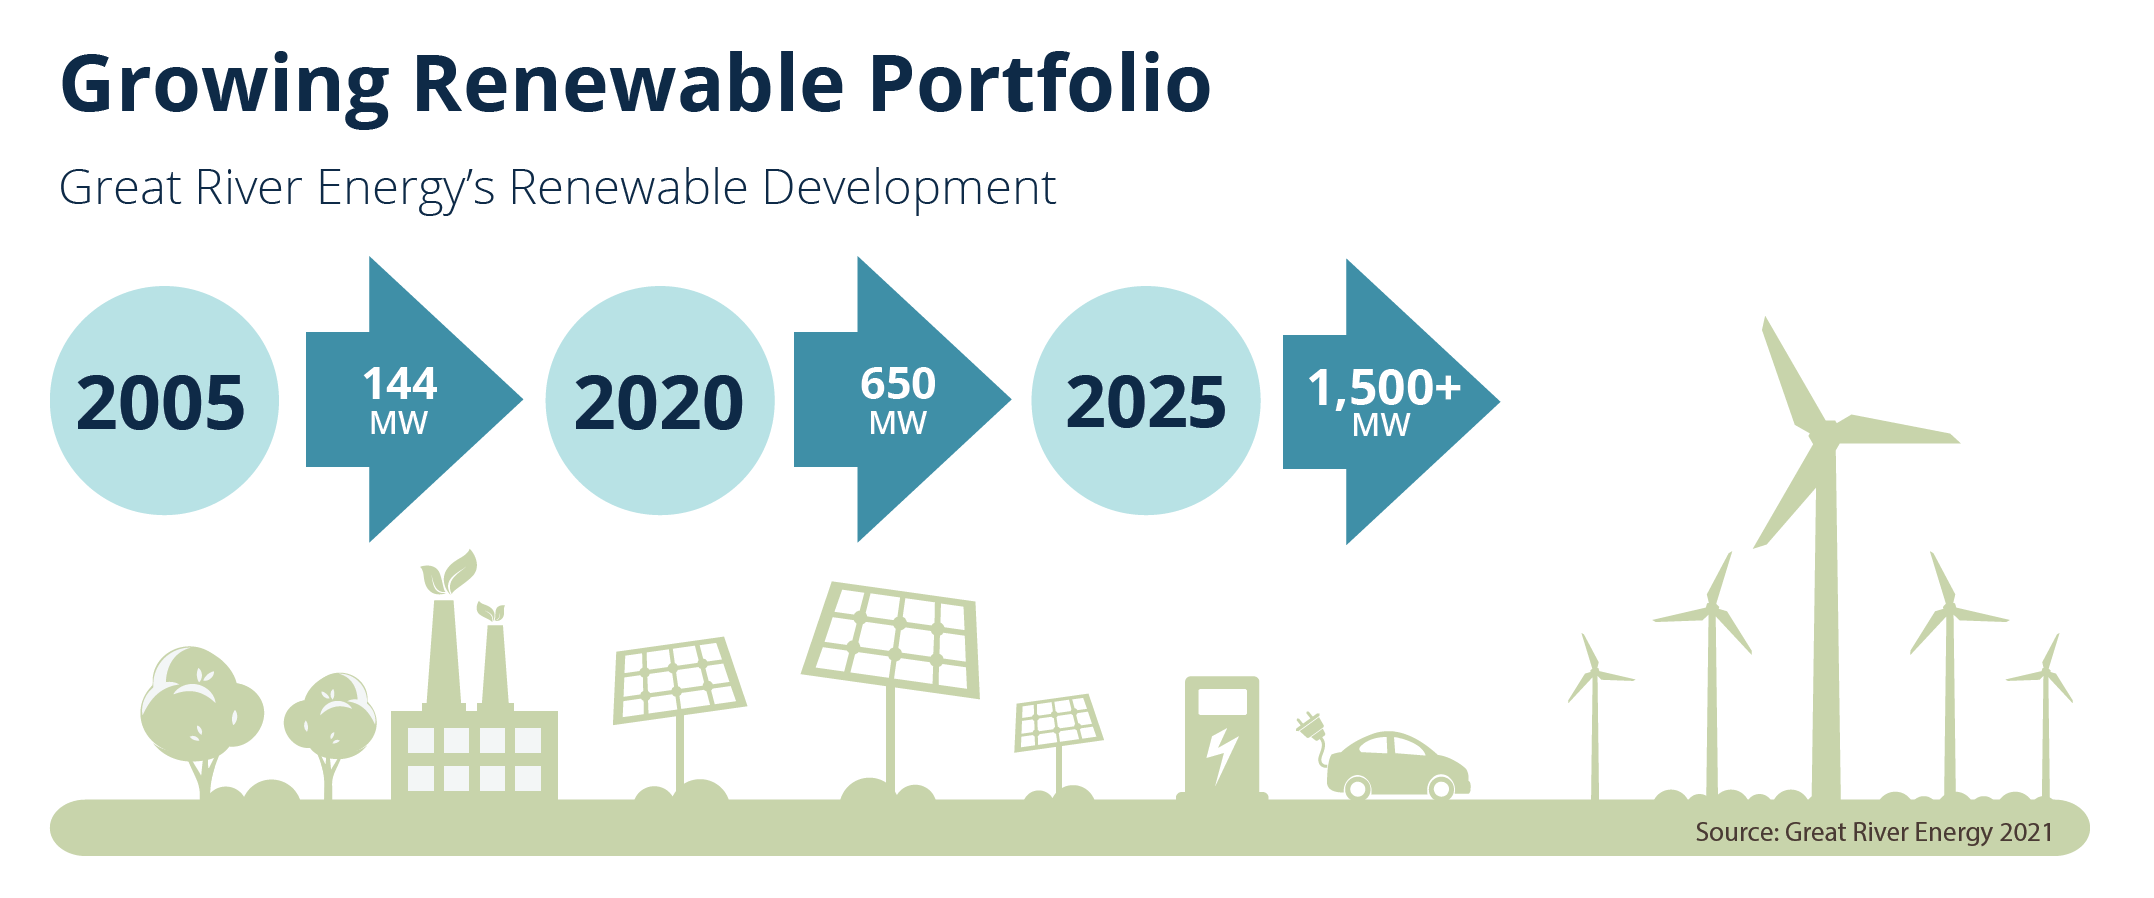
Infographic, blue circles and arrows showing renewable energy production over a span of 20 years
Infographic, blue circles and arrows showing renewable energy production over a span of 20 years
Dakota Electric Association
4300 220th Street West
Farmington, Minnesota 55024
7a.m.-5:30p.m. Mon.-Fri.
Local: 651-463-6201
Toll-Free: 1-800-430-9722
Local: 651-463-6212
Toll-Free: 1-800-874-3409
Hearing Impaired: Dial 711
