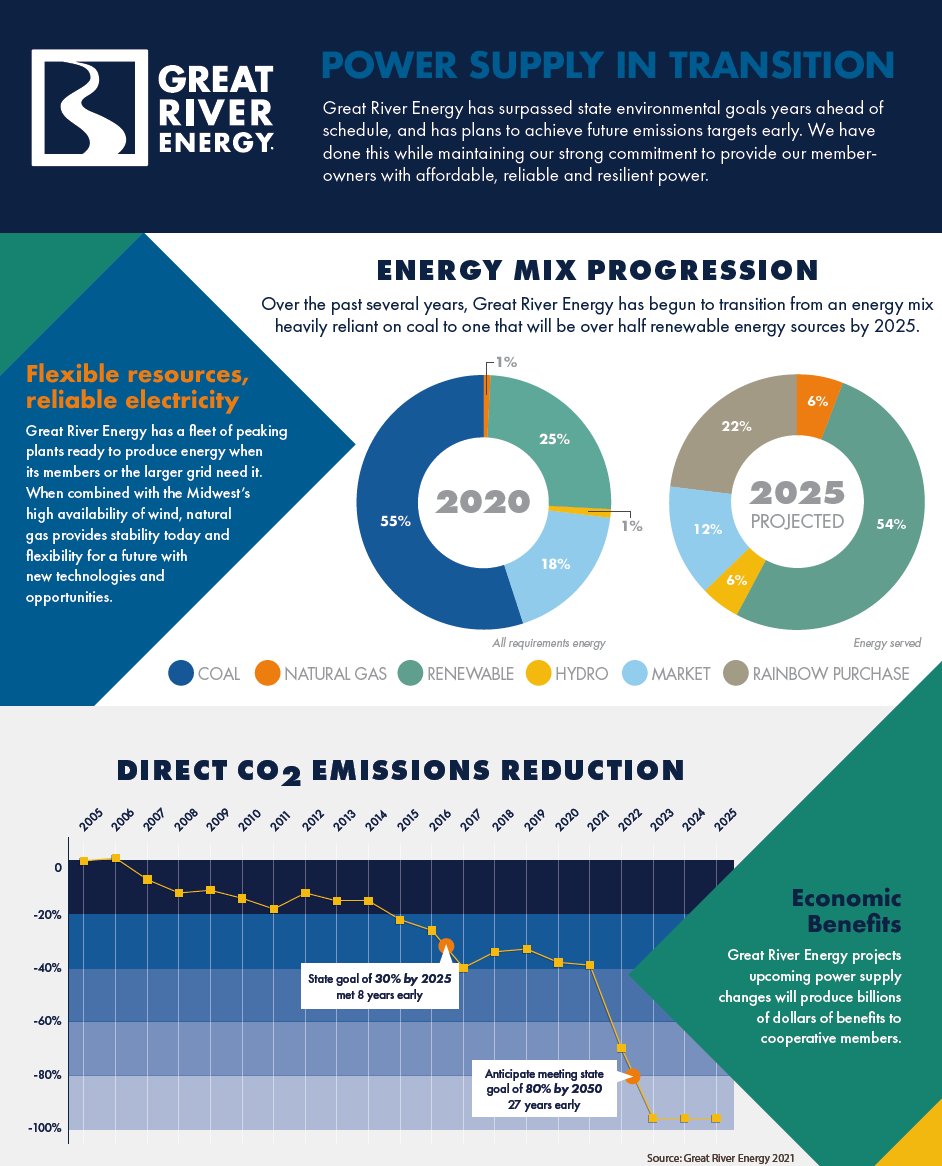
Infographic, Pie charts and line Graphs explaining GRE’s Energy Mix Progression
Infographic, Pie charts and line Graphs explaining GRE’s Energy Mix Progression
Dakota Electric Association
4300 220th Street West
Farmington, Minnesota 55024
7a.m.-5:30p.m. Mon.-Fri.
Local: 651-463-6201
Toll-Free: 1-800-430-9722
Local: 651-463-6212
Toll-Free: 1-800-874-3409
Hearing Impaired: Dial 711
